Difference between revisions of "ThreadScope"
(→Getting Started: install via stack) |
|||
| Line 53: | Line 53: | ||
* Windows: [http://projects.haskell.org/ThreadScope/threadscope-0.2.2.zip threadscope-0.2.2.zip] |
* Windows: [http://projects.haskell.org/ThreadScope/threadscope-0.2.2.zip threadscope-0.2.2.zip] |
||
* Mac OSX: [http://projects.haskell.org/ThreadScope/threadscope-0.2.2.dmg threadscope-0.2.2.dmg] |
* Mac OSX: [http://projects.haskell.org/ThreadScope/threadscope-0.2.2.dmg threadscope-0.2.2.dmg] |
||
| + | |||
| + | Newer binary releases for some operating systems may appear at the [https://github.com/haskell/ThreadScope/releases github page]. |
||
If you use one of these, you are good to go and do not need anything else. |
If you use one of these, you are good to go and do not need anything else. |
||
Revision as of 15:12, 21 April 2017
ThreadScope is a tool for performance profiling of parallel Haskell programs.
The ThreadScope program allows us to debug the parallel performance of Haskell programs. Using ThreadScope we can check to see that work is well balanced across the available processors and spot performance issues relating to garbage collection or poor load balancing.
Getting Started
Have gtk on your machine? (Note that you don't need all of gtk and gtk2hs, e.g., libxml is unneeded.) See the gtk2hs install instructions (Windows ∙ Mac ∙ Linux) and then run following commands
   cabal update
   cabal install gtk
   cabal install threadscope
alternatively, if you have stack, you can install threadscope by running
stack install threadscope
Next, check out the user guide. We call it the ThreadScope Tour.
Features
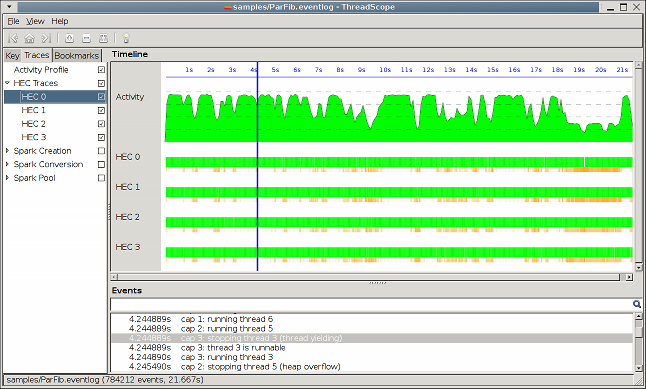
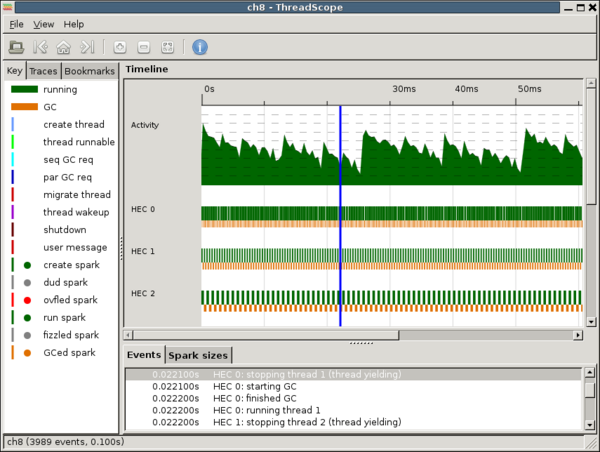
ThreadScope is a graphical viewer for thread profile information generated by the Glasgow Haskell compiler (GHC). An example is shown below:
ThreadScope version 0.2.0 can be used to help debug performance issues with parallel and concurrent Haskell programs. The program has the following features.
- The program displays the activity on each Haskell Execution Context (HEC) which roughly corresponds to an operating system thread. For each thread you can see whether it is running a Haskell thread or performing garbage collection. You can find out information about when Haskell threads are ready to run and information about why a Haskell thread was suspended.
- An activity profile indicates the rough utilization of the HECs and when the number of HECs are greater than the number of processing cores this gives a rough guide to the overall utilization.
- You can view the rate at which "par sparks" are created and evaluated during the program, and the size of the spark queue on each HEC. (This feature requires GHC-7.3 or later which is currently the development version.)
Using ThreadScope
To compile a program for parallel profiling use the -eventlog flag and you will also want to use the -threaded flag to compile with the multi-threaded runtime e.g.
ghc -threaded -eventlog -rtsopts --make Wombat.hs
To execute a program and generate a profile use the -ls flag after +RTS. Then pass the profile to ThreadScope:
 ./Wombat +RTS -ls -N2
 threadscope Wombat.eventlog # on Windows: Wombat.exe.eventlog
The -N2 flag specifies the use of two Haskell Execution Contexts (i.e. cores). Once the program has been run it will produce a profile file called Wombat.eventlog or Wombat.exe.eventlog (depending on your operating system). You can now view this file with threadscope by specifying the eventlog filename as a command line argument or by navigating to it from the File menu of ThreadScope.
For more detailed instructions, have a look at the ThreadScope Tour.
Installing ThreadScope
Binary releases
For Windows and OSX there are binary releases available:
- Windows: threadscope-0.2.2.zip
- Mac OSX: threadscope-0.2.2.dmg
Newer binary releases for some operating systems may appear at the github page.
If you use one of these, you are good to go and do not need anything else.
Building from source
If you're on another OS or adventurous, you can build ThreadScope from source.
The recommendation is to use the Haskell Platform. This includes GHC and the cabal package tool. At minimum you need GHC-6.12.
ThreadScope is available from hackage.
ThreadScope has a dependency on the Haskell Gtk+ binding (Gtk2Hs) which involves a bit of manual work on Windows and Mac OS X to install the Gtk+ C libraries.
See the Gtk2Hs installation instructions for details:
- Gtk2Hs/Linux (and other unix)
- Gtk2Hs/Windows
- Gtk2Hs/Mac
Once you have the Gtk+ C libraries installed it is just a matter of running:
cabal install threadscope
Checking that ThreadScope works
Once you installed ThreadScope, you can try to run it to make sure it works correctly by viewing a built-in sample trace:
threadscope --test ch8
More Information
- Parallel Performance Tuning for Haskell.
- Runtime Support for Multicore Haskell.
- A Tutorial on Parallel and Concurrent Programming in Haskell.
- A video by Simon Marlow which demos ThreadScope.
You may also wish to join the parallel-haskell google group.
Development and reporting bugs
ThreadScope development takes place on the ThreadScope github page. Please file your bug reports over there.
The source for ghc-events and threadscope is available from github
   git clone git@github.com:haskell/ghc-events.git
   git clone git@github.com:haskell/ThreadScope.git
People
- Donnie Jones, donnie@darthik.com
- Simon Marlow, simonmar@microsoft.com, http://www.haskell.org/~simonmar/
- Satnam Singh, s.singh@acm.org, http://cs.bham.ac.uk/~singhsu/
- Duncan Coutts, duncan@well-typed.com, http://www.well-typed.com/who_we_are
- Mikolaj Konarski, mikolaj@well-typed.com
- Nicolas Wu, nick@well-typed.com
- Eric Kow, eric@well-typed.com
Publications and Talks
Simon Marlow, Simon Peyton Jones, and Satnam Singh, Runtime Support for Multicore Haskell, in ICFP 2009, Association for Computing Machinery, Inc., 5 September 2009
Don Jones Jr., Simon Marlow, and Satnam Singh, Parallel Performance Tuning for Haskell, in ACM SIGPLAN 2009 Haskell Symposium, Association for Computing Machinery, Inc., 3 September 2009
Duncan Coutts, Mikolaj Konarski and Andres Loeh, Spark Visualization in ThreadScope, Haskell Implementors Workshop 2011

