Hoed
Hoed is a lightweight tracer and algorithmic debugger that is practical to use for real-world programs.
Installing Hoed
Hoed is available and can be installed with
cabal install Hoed
To render figures in explore mode Hoed uses Graphviz, installing Graphviz is optional but recommended.
We also made several defective example programs available. These can be installed by downloading the tarball under the header Downloads from http://hackage.haskell.org/package/Hoed. After unpacking the tarball you can build Hoed and some example programs with
  sh configure.Demo
  cabal build
with the run script you are given a list of example programs to chose from to execute
sh run
Using Hoed
To locate a defect with Hoed you annotate suspected functions and compile as usual. Then when you run your program, information about the annotated functions is collected. Finally you connect to a debugging session using a web browser.
Let us consider the following program: a defective implementation of a parity function with a test property.
isOdd :: Int -> Bool
isOdd n = isEven (plusOne n)

isEven :: Int -> Bool
isEven n = mod2 n == 0

plusOne :: Int -> Int
plusOne n = n + 1

mod2 :: Int -> Int
mod2 n = div n 2

prop_isOdd :: Int -> Bool
prop_isOdd x = isOdd (2*x+1)
Using the property-based test tool QuickCheck we find the counterexample #1 for our property.
> quickCheck prop_isOdd
*** Failed! Falsifiable (after 1 test): 1
Hoed can help us determine which function is defective. We annotate the functions isOdd, isEven, plusOne and mod2 as follows:
import Debug.Hoed.Pure

isOdd :: Int -> Bool
isOdd = observe "isOdd" isOdd'
isOdd' n = isEven (plusOne n)

isEven :: Int -> Bool
isEven = observe "isEven" isEven'
isEven' n = mod2 n == 0

plusOne :: Int -> Int
plusOne = observe "plusOne" plusOne'
plusOne' n = n + 1

mod2 :: Int -> Int
mod2 = observe "mod2" mod2'
mod2' n = div n 2

prop_isOdd :: Int -> Bool
prop_isOdd x = isOdd (2*x+1)
Now we use the combinator testO to trace our program for the counterexample of our property. After running the program a computation tree is constructed and displayed in a web browser.
> testO prop_isOdd 1
*** Failed! Falsifiable: 1
Listening on http://127.0.0.1:10000/
You can freely browse this tree to get a better understanding of your program. If your program misbehaves, you can judge the computation statements in the tree as 'right' or 'wrong' according to your intention. When enough statements are judged the debugger tells you the location of the fault in your code.
Annotating Functions
A function is annotated using an observe primitive with a String. An arbitrary value can be used, but we use the function name to have it in the trace for constructing the computation tree. For example, the function
isOdd n = isEven (plusOne n)
can be annotated as follows
isOdd = observe "isOdd" isOdd'
isOdd' n = isEven (plusOne n)
To observe a function its argument and result type need to be of typeclass Observable. Hoed comes with instances for the base types and several other commonly used types.
It is easy to make your own types Observable because Hoed also provides a type-generic instance. For example:
data Person = Person String Int deriving Generic
instance Observable Person

data Tree a = Node a [Tree a] | Leaf deriving Generic
instance Observable a => Observable (Tree a)
Views
Hoed offers several views on the collected debugging information.
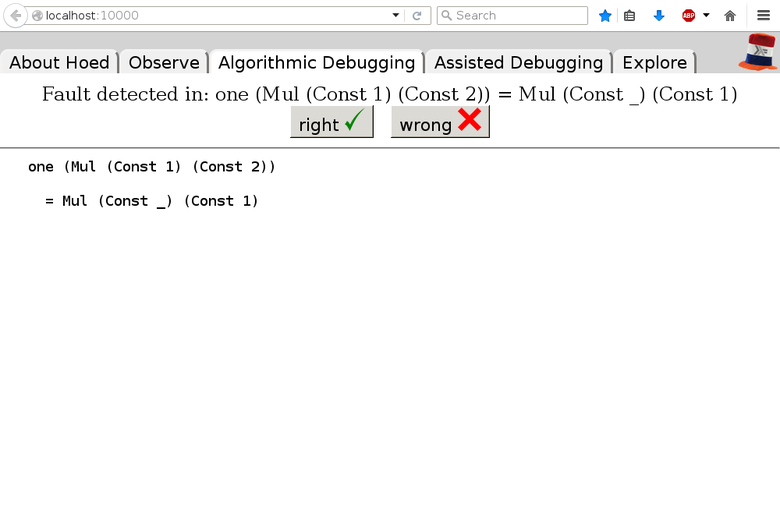
Algorithmic Debugging: Hoed uses Hood's observe technique to record information during a program execution that shows unintended behaviour. Hoed's post-mortem algorithmic debugging view presents the user with questions about intermediate computation statements. The user has to judge whether these statements agree with their intentions. After some questions and answers, the debugger locates a defect in a slice (i.e.\ part) of the program.
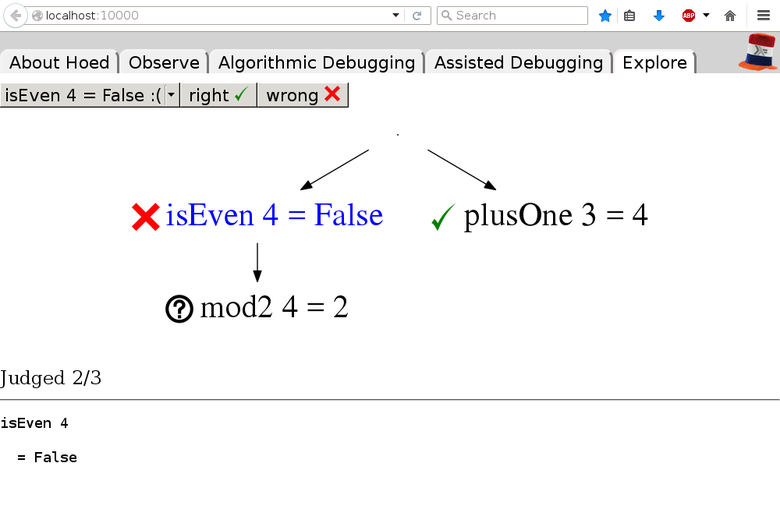
Explore: Hoed organizes the computation statements in a tree. In this mode the computation tree can be freely explored.

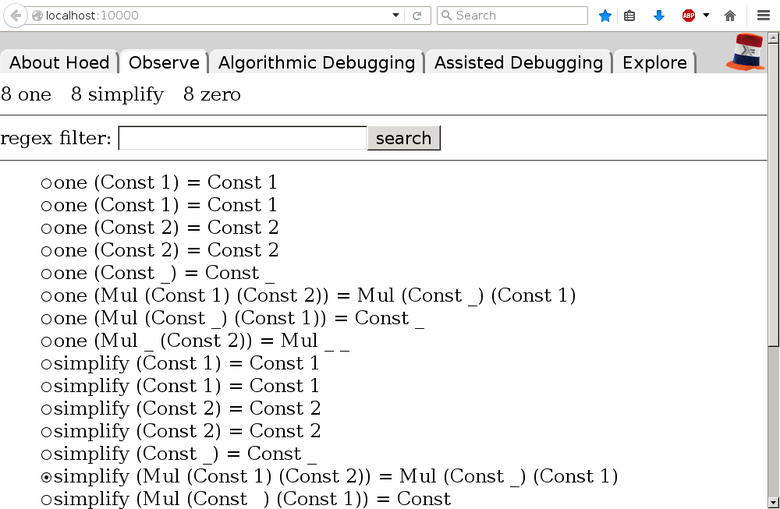
Observe: A list view of the computation statements that can be searched with a simple keyword or a regular expression. One of the computation statements can be selected and used as starting point for one of the other modes.

Comparison with Other Tracers and Debuggers
Hat is probably the most advanced tracer tool for Haskell. It traces every reduction and provides many tools for viewing this trace. Hat requires a transformation of every module, even libraries we are not interested in. The transformation does not support as many language features as GHC and in practice many programs cannot be debugged with Hat. In contrast, Hoed is just a library and only functions we are interested in need to be annotated. Many programs that are difficult to debug with Hat can be debugged with Hoed.
Most Haskell implementations come with a trace primitive that can be used for printf style debugging. However, the primitive can force evaluation. Consider for example applying the function headDoubler> to [1..] in
headDoubler xs = trace ("headDoubler " ++ show xs) (2 * head (xs) : tail xs)

main = print (take 3 (headDoubler [1..]))
HOOD can be used like Debug.Trace for printf-style debugging while respecting evaluation order. Observing headDoubler in above example gives headDoubler (1:2:3:_) = 2:2:3:_. Hoed is based on HOOD, but gives a relation between computation statements and adds an algorithmic debugger.
