Hackage statistics: Difference between revisions
No edit summary |
No edit summary |
||
| Line 16: | Line 16: | ||
[[Image:Hackage-cumulative.svg]] | [[Image:Hackage-cumulative.svg]] | ||
[[Image:Hackage-cumulative-normal.svg]] | |||
(Via the Haskell [http://hackage.haskell.org/cgi-bin/hackage-scripts/package/gnuplot gnuplot] bindings). | (Via the Haskell [http://hackage.haskell.org/cgi-bin/hackage-scripts/package/gnuplot gnuplot] bindings). | ||
Revision as of 19:16, 11 February 2012
A sparkline depicting statistics about the Haskell library repository, http://hackage.haskell.org.
Updates this month by day
Updates per month since 2007
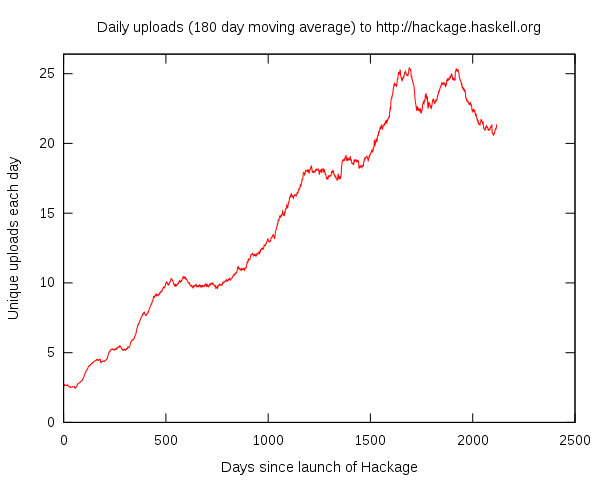
Releases of Haskell libraries and tools per day, on hackage, since inception
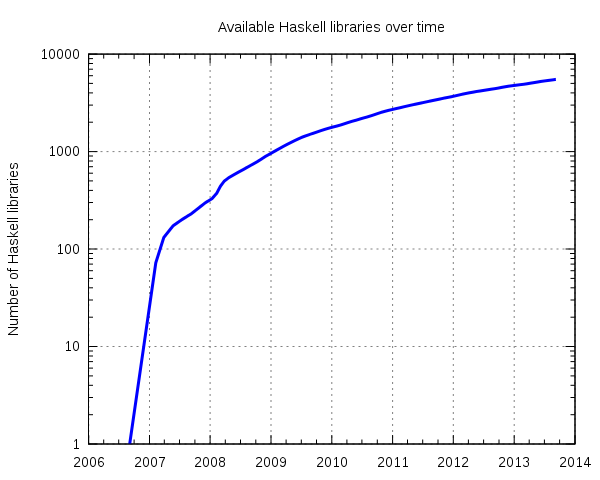
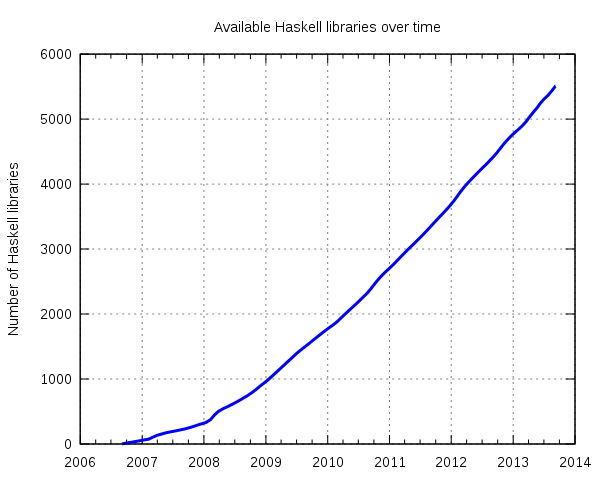
Available Haskell packages over time
(Via the Haskell gnuplot bindings).
Statistics
http://hackage.haskell.org/cgi-bin/hackage-scripts/stats
Graphics generated by the hsparklines library, by way of hackage-sparks.


