ThreadScope Tour/Consolidate
Objectives
Gain a clearer understanding of performance behaviour by separating sequential and parallel parts of the computation
Steps
Build sudoku3 and examine the ThreadScope profile.
rm sudoku3
ghc -O2 sudoku3.hs -threaded -rtsopts -eventlog
./sudoku3 sudoku17.1000.txt +RTS -N2 -l
threadscope sudoku3.eventlog
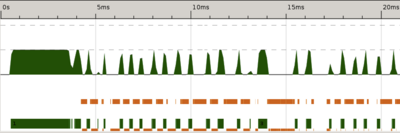
Zoom to the beginning of the program runtime where there seems to be very little activity.
Notice the activity spikes. We alternate between using both cores and waiting for garbage collection. Parallel and Concurrent Programming in Haskell suggests that "In fact, what we are seeing here is the program reading the input file (lazily) and dividing it into lines, driven by the demands of
parMapwhich traverses the whole list of lines"See what happens when we add an
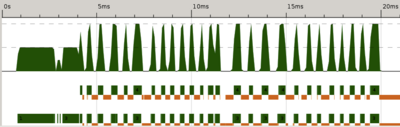
evaluate (length grids)to force the file reading to happen in one go first. Build sudoku4, run it, and examine the ThreadScope profile.rm sudoku4 ghc -O2 sudoku4.hs -threaded -rtsopts -eventlog ./sudoku4 sudoku17.1000.txt +RTS -N2 -l threadscope sudoku4.eventlog
Zoom to the beginning of the program runtime as before. It may help to keep both sudoku3 and sudoku4 eventlogs on the same screen