ThreadScope Tour/Zoom
Objectives
- Use zooming to reveal more detailed performance issues
- Save your place with the bookmark feature and zoom back out
Steps
Open the sudoku3 ThreadScope profile created earlier
threadscope ./sudoku3.eventlog
Notice the initial lack of activity at the very beginning of program execution
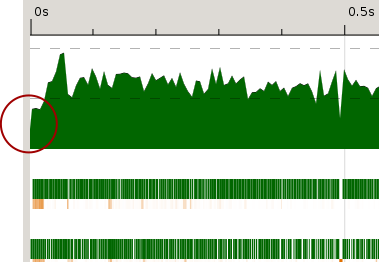
What's going on there?
Use the zoom in button to explore that space a bit more
Hint: you can also press +/- on the keyboard
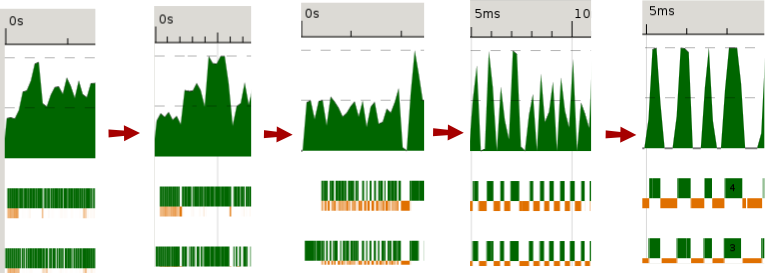
Notice how different the profile looks close up. What do you see? At closer inspection what looks like a moderate amount of activity is actually intense bursts using both cores, with pauses in between.
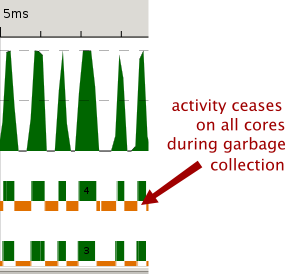
While you're zoomed in, observe the link between activity and garbage collection.
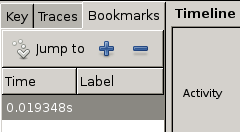
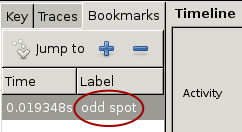
Save a point in the zoomed-in profile as a bookmark. To do so, click in the graph to move the blue cursor to a spot of your choice.
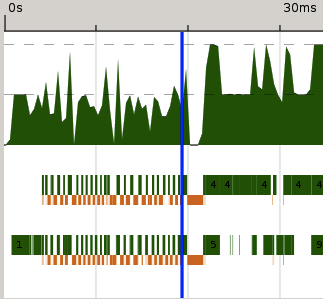
Then switch to bookmarks tab. Press the plus button to create the bookmark and click in the labels field to name it.
- TODO zoom out again, use bookmarks to help refocus


Hints
- You can also press +/- on the keyboard to zoom in and out