Timeplot
Timeplot is a program for visualizing data from log files.
Large presentation[edit]
See this one: http://www.slideshare.net/jkff/two-visualization-tools Or download: http://jkff.info/presentations/two-visualization-tools.pdf
It has much more pretty and practical pictures than the current page.
Installation[edit]
Cabal[edit]
timeplot is available as a package on hackage: http://hackage.haskell.org/package/timeplot
So you can do
cabal install timeplot
You can also do
cabal install timeplot --flags=gtk
to enable rendering to a window ("-of x")
Windows[edit]
Install haskell-platform, install gtk2hs, then do
cabal install timeplot
However, you'll probably need some text processing tools to make use of timeplot. Download awk (in cygwin or MinGW), perl or hack something in PowerShell.
Debian[edit]
No distribution so far, but you can install from cabal, and all the necessary dependencies are apt-get-install'able.
Install haskell-platform.
sudo apt-get install libghc6-gtk-dev
cabal install timeplot
And you're done. If you need profiling, you'll have to install GTK bindings with Cabal; to install the many compile time dependencies, use this snippet of shell:
apt-cache show libghc6-{gtk,cairo,glib}-dev |
sed -rn '/^Depends: / { s/// ; s/ [(][^()]+[)]//g ; s/, /\n/g ; p }' |
fgrep -v ghc6 | sudo xargs apt-get install
Arch Linux[edit]
pacman -S timeplot
Dependencies[edit]
In any case, you'll need haskell-platform for your OS. Install it first, if you're not a haskeller. Then install timeplot using cabal.
If you're building with "--flags=gtk", you'll need gtk2hs. On Ubuntu, you can install it with:
sudo apt-get install libghc6-gtk-dev
If you're building without gtk, you'll just need cairo. It is also part of gtk2hs, but perhaps easier to build. Contact me (ekirpichov at gmail) if you have problems. You can also try reading gtk2hs installation guide.
Usage scenario[edit]
A log file is preprocessed by an application-specific awk one-liner to produce input for timeplot.
Timeplot plots the input as several graphs of various kind with a common time axis.
Input[edit]
Conceptually, the input for timeplot is a collection of several tracks corresponding to different concurrent processes occuring in the logs, or to different characteristics of a process. There are 3 kinds of tracks:
- Counter/Event tracks: Such a track represents a counter that may be bumped up and down: for example, a user login event bumps the user counter up and a logout event bumps the counter down. This may be also thought of as a binary event track: the event starts and ends at some time instants - for example, a process of periodical reloading of some data. Such a track may also have 'pulse' events that tell that at a time moment something happened with the track. For example, we might have a track for errors and pulse it every time a request happens. It is also possible to plot graphs over durations of events on these event tracks.
- Numeric tracks: Such a track represents observations of a numeric value at certain time instants. Example: HTTP server response time, memory usage etc.
- Discrete tracks: Such a track represents observations of a discrete value at certain time instance. Example: current thread ID, HTTP server response code, request type, log message level.
Physically, the input for timeplot consists of lines, each line speaking about a time instant, the times being sorted in ascended order. Each line has a time field, an event type field and a track field. There are 5 kinds of input lines:
Bump up, bump down and pulse at a counter track:
 TIME >TRACK
 TIME <TRACK
 TIME !TRACK
 2009-10-23 21:03:56 >Users
 2009-10-23 22:13:02 <Users

 2009-10-23 18:45:00 !IncomingMail
Value observation at a numeric track:
TIME =TRACK VALUE
2009-10-23 21:03:56 =ResponseTime 6.452
Discrete observation at a discrete track:
TIME =TRACK `VALUE
2009-10-23 21:03:56 =Page `register.php
Format of the time field is customizable: time may either be represented by an integer number in the interval 0..2^31-1, or by a date formatted according to a format string in the format of strptime.
Output[edit]
The output of timeplot is a vertical stack of charts of the kinds specified below, with their time axes aligned horizontally so that one may observe the interaction of events in different tracks.
timeplot currently supports the following kinds of charts:
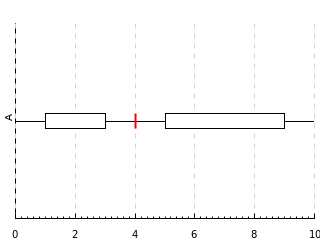
- Event plots ('event')
A sample event plot.
- Any of the plots below over event durations ('duration .....')
- Line plots ('lines') and dot plots ('dots')
A sample line plot. Dot plot is like this, but without lines and with circles at data points.
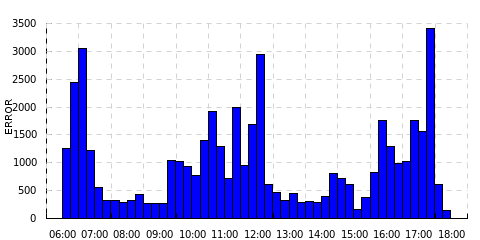
- Counter histograms ('hist N')
How many errors occured in a program in 15-minute intervals.
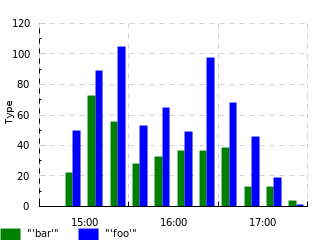
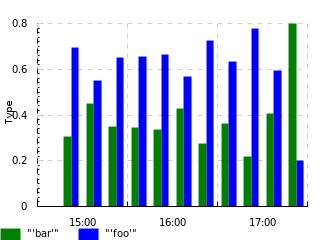
- Absolute and relative frequency histograms ('count N' and 'freq N')
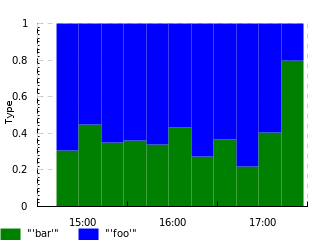
The distribution of request types along 15-minute intervals in a program where there are just 2 of them, presented in the form of absolute counts and relative frequencies, and in clustered and stacked fashion.
- Quantile histograms ('quantile N q1,q2,..')
That same line plot, but now for each day the minimum, median and maximum (0%, 50% and 100% quantiles respectively) values are shown
- Absolute and relative interval frequency histograms ('binc N v1,v2,..', 'binf N v1,v2,..')
Distribution of response times of a search program into bins of 0..100ms, 100..500ms, 500..1000ms, 1000..5000ms and >5000ms.
Help[edit]
jkff@jkff-laptop:~/projects/hackage/timeplot$ tplot
tplot - a tool for drawing timing diagrams. See http://www.haskell.org/haskellwiki/Timeplot
Usage: tplot [-o OFILE] [-of {png|pdf|ps|svg|x}] [-or 640x480] -if IFILE [-tf TF]
             [-k Pat1 Kind1 -k Pat2 Kind2 ...] [-dk KindN]
  -o  OFILE - output file (required if -of is not x)
  -of       - output format (x means draw result in a window, default: extension of -o)
  -or       - output resolution (default 640x480)
  -if IFILE - input file; '-' means 'read from stdin'
  -tf TF    - time format: 'num' means that times are floating-point numbers
              (for instance, seconds elapsed since an event); 'date PATTERN' means that times are dates
              in the format specified by PATTERN - see http://linux.die.net/man/3/strptime,
              for example, [%Y-%m-%d %H:%M:%S] parses dates like [2009-10-20 16:52:43].
              We also support %OS for fractional seconds (i.e. %OS will parse 12.4039 or 12,4039).
              Default: 'date %Y-%m-%d %H:%M:%OS'
  -k P K    - set diagram kind for tracks matching regex P (in the format of regex-tdfa, which
              is at least POSIX-compliant and supports some GNU extensions) to K
              (-k clauses are matched till first success)
  -dk       - set default diagram kind
  -fromTime - filter records whose time is >= this time (formatted according to -tf)
  -toTime   - filter records whose time is <  this time (formatted according to -tf)
Input format: lines of the following form:
1234 >A - at time 1234, during event A has begun
1234 <A - at time 1234, during event A has ended
1234 !B - at time 1234, pulse event B has occured
1234 @B COLOR - at time 1234, the status of B became such that it is appropriate to draw it with color COLOR :)
1234 =C VAL - at time 1234, parameter C had numeric value VAL (for example,  HTTP response time)
1234 =D `EVENT - at time 1234, event EVENT occured in process D (for example, HTTP response code)
It is assumed that many events of the same kind may occur at once.
Diagram kinds:
  'event' is for event diagrams: during events are drawn like --[===]--- , pulse events like --|--
  'duration XXXX' - plot any kind of diagram over the *durations* of events on a track (delimited by > ... <)
     for example 'duration quantile 300 0.25,0.5,0.75' will plot these quantiles of durations of the events.
     This is useful where your log looks like 'Started processing' ... 'Finished processing': you can plot
     processing durations without computing them yourself.
 'duration[C] XXXX' - same as 'duration', but of a track's name we only take the part before character C.
     For example, if you have processes named 'MACHINE-PID' (i.e. UNIT027-8532) say 'begin something' /
     'end something' and you're interested in the properties of per-machine durations, use duration[-].
  'hist N' is for histograms: a histogram is drawn with granularity of N time units, where
     the bin corresponding to [t..t+N) has value 'what was the maximal number of active events
     in that interval'.
  'freq N [TYPE]' is for event frequency histograms: a histogram of type TYPE (stacked or
     clustered, default clustered) is drawn for each time bin of size N, about the distribution
     of various ` events
  'count N [TYPE]' is for event frequency histograms: a histogram of type TYPE (stacked or
     clustered, default clustered) is drawn for each time bin of size N, about the counts of
     various ` events
  'quantile N q1,q2,..' (example: quantile 100 0.25,0.5,0.75) - a bar chart of corresponding
     quantiles in time bins of size N
  'binf N v1,v2,..' (example: binf 100 1,2,5,10) - a bar chart of frequency of values falling
     into bins min..v1, v1..v2, .., v2..max in time bins of size N
  'binc N v1,v2,..' (example: binf 100 1,2,5,10) - a bar chart of counts of values falling
     into bins min..v1, v1..v2, .., v2..max in time bins of size N
  'lines'  - a simple line plot of numeric values
  'dots'   - a simple dot plot of numeric values
  'cumsum' - a simple line plot of the sum of the numeric values
  'sum N'  - a simple line plot of the sum of the numeric values in time bins of size N
N is measured in units or in seconds.
Usage example on made-up data[edit]
Suppose we've got a log of the following format:
...
[2009-10-23 04:43:28,669] DEBUG 186.76.115.174 GET /product.php?id=46 200 24 Cache hit!
[2009-10-23 04:43:29,175] DEBUG 178.188.73.231 GET /product.php?id=39 200 443 Cache miss!
[2009-10-23 04:43:29,210] DEBUG 135.78.12.242 GET /basket.php 200 410 Cache miss!
...
[2009-10-23 06:11:32,460] INFO Reloading product data started...
...
[2009-10-23 10:54:22,610] INFO Reloading product data finished
...
And we're interested in the influence that product data reloading (a very lengthy process that reads data from a big file into memory) has on response time and on cache hit rate. We also think that the influence on response time might be different for different pages.
Let us decompose this log into the following tracks and events:
- One event track for index reloading
- One numeric track for each page type: response time
- One global discrete track for cache events: hit/miss
- One discrete track per page type for cache events: hit/miss
The following awk script will generate an input for timeplot:
$ cat <<END >log.awk
function t(){return $1 " " $2}
function p(){sub(/\?.*/,"",$6); return $6}
/GET/{print t() " =GET" p() " " $8; print t() "=PAGE `" p()}
/Cache hit/{print t() " =Cache `Hit"; print t() " =Cache" p() " `Hit"}
/Cache miss/{print t() " =Cache `Miss"; print t() " =Cache" p() " `Miss"}
/Reload.*start/{print t() " >Reload"}
/Reload.*finish/{print t() " <Reload"}
END
$ awk -f log.awk /var/log/program.log > program.trace
$ head program.trace
[2009-10-23 04:43:28,669] =GET/product.php 24
[2009-10-23 04:43:28,669] =Page `/product.php
[2009-10-23 04:43:28,669] =Cache `Hit
[2009-10-23 04:43:28,669] =Cache/product.php `Hit
[2009-10-23 04:43:29,175] =GET/product.php 443
[2009-10-23 04:43:29,175] =Page `/product.php
[2009-10-23 04:43:29,175] =Cache `Miss
[2009-10-23 04:43:29,175] =Cache/product.php `Miss
[2009-10-23 04:43:29,210] =GET/basket.php 410
[2009-10-23 04:43:29,210] =Page `/basket.php
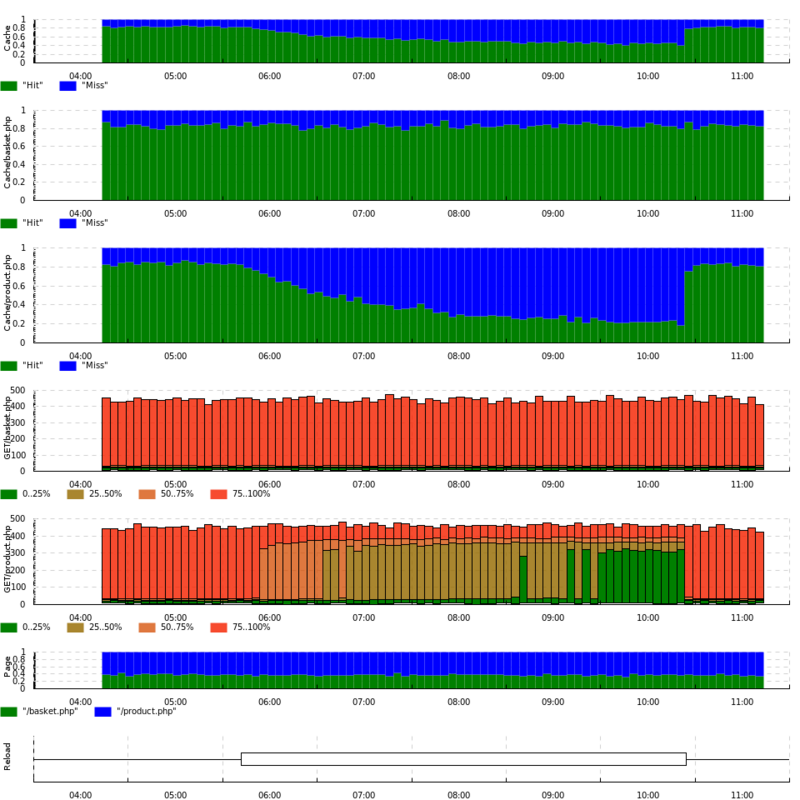
$ time tplot -o biglog.png -or 960x960 -k 'GET.*' 'quantile 300 0.25,0.5,0.75' -k 'Cache/.*' 'freq 300 stacked' \
  -k Cache 'freq 300 stacked' -k Reload event -k Page 'freq 300 stacked' \
  -if program.trace -tf 'date [%Y-%m-%d %H:%M:%OS]'
real	0m2.631s
user	0m2.500s
sys	0m0.124s
Here is the log file and the trace file.
And here is what we get:
We can make the following observations:
- Reloading product data seems to gradually take up memory and decrease efficiency of the cache
- Cache efficiency changes only for product.php
- Response time for product.php depends crucially on cache efficiency
- Quantiles of response time for product.php change sharply, not smoothly, at certain thresholds of cache hit rate.
(remember that the data is made up, and probably does not fairly represent the typical behavior of a web application)
All in all, this analysis leads to a thought that the first thing to fix in this program is memory efficiency and duration of data reloading, since it has a great impact on overall program performance.
Real-world output example[edit]
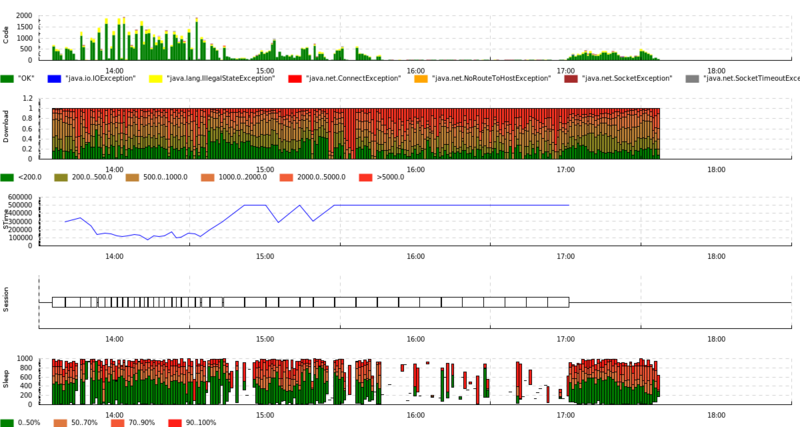
This is the output of timeplot on a log file from a pinger program. It depicts the distribution of response times and HTTP errors, the distribution of per-host wait times (to avoid DOS'ing a particular host, the per-host request rate is limited), pinging sessions start/end moments and their durations.
