Splot
splot is available from hackage: http://hackage.haskell.org/package/splot
Large presentation
See this one: http://www.slideshare.net/jkff/two-visualization-tools Or download: http://jkff.info/presentations/two-visualization-tools
It has much more pretty and practical pictures than the current page.
Installation
Similar to Timeplot.
Help
splot - a tool for visualizing the lifecycle of many concurrent multi-stage processes. See http://www.haskell.org/haskellwiki/Splot
Usage: splot [-o PNGFILE] [-w WIDTH] [-h HEIGHT] [-bh BARHEIGHT] [-tf TIMEFORMAT] [-sort SORT] [-expire EXPIRE]
             [-tickInterval TICKINTERVAL]
  -o PNGFILE    - filename to which the output will be written in PNG format.
                  If omitted, it will be shown in a window.
  -w, -h        - width and height of the resulting picture. Default 640x480.
  -bh           - height of the bar depicting each individual process. Default 5 pixels.
                  Use 1 or so if you have a lot of them.
  -tf           - time format, as in http://linux.die.net/man/3/strptime but with
                  fractional seconds supported via %OS - will parse 12.4039 or 12,4039
  -tickInterval - ticks on the X axis will be this often (in millis).
  -sort SORT    - sort tracks by SORT, where: 'time' - sort by time of first event,
                  'name' - sort by track name.
  -expire       - expire activities after given time period (in millis) - for instance,
                  to account that if an activity doesn't tell you it's finished for too long,
                  then it probably was killed.
Input is read from stdin. Example input (speaks for itself):
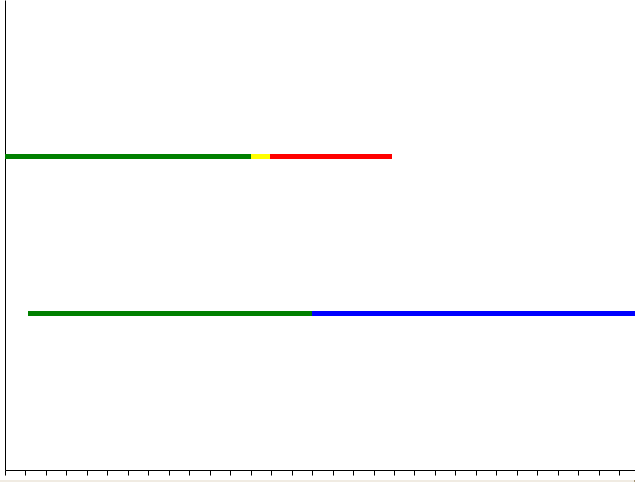
2010-10-21 16:45:09,431 >foo green
2010-10-21 16:45:09,541 >bar green
2010-10-21 16:45:10,631 >foo yellow
2010-10-21 16:45:10,725 >foo red
2010-10-21 16:45:10,930 >bar blue
2010-10-21 16:45:11,322 <foo
2010-10-21 16:45:12,508 <bar
'>FOO COLOR' means 'start a bar of color COLOR on track FOO',
'<FOO' means 'end the current bar for FOO'.
> cat <<END |splot -tickInterval 100
2010-10-21 16:45:09,431 >foo green
2010-10-21 16:45:09,541 >bar green
2010-10-21 16:45:10,631 >foo yellow
2010-10-21 16:45:10,725 >foo red
2010-10-21 16:45:10,930 >bar blue
2010-10-21 16:45:11,322 <foo
2010-10-21 16:45:12,508 <bar
And here's what we get:
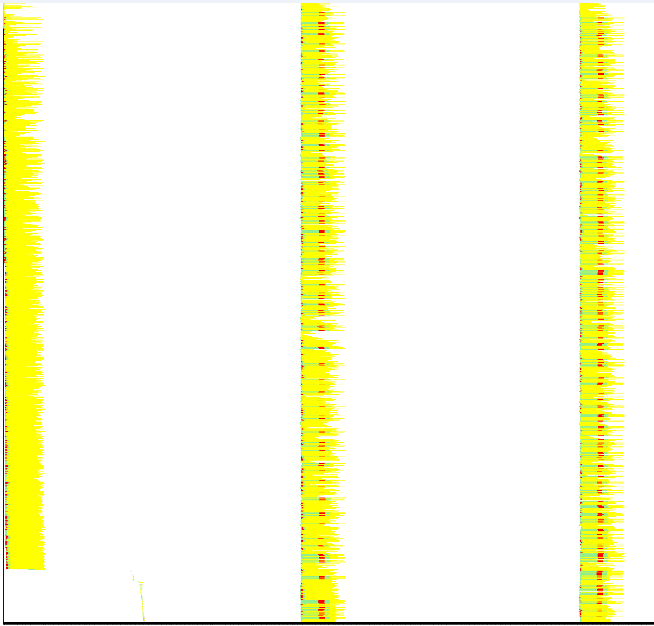
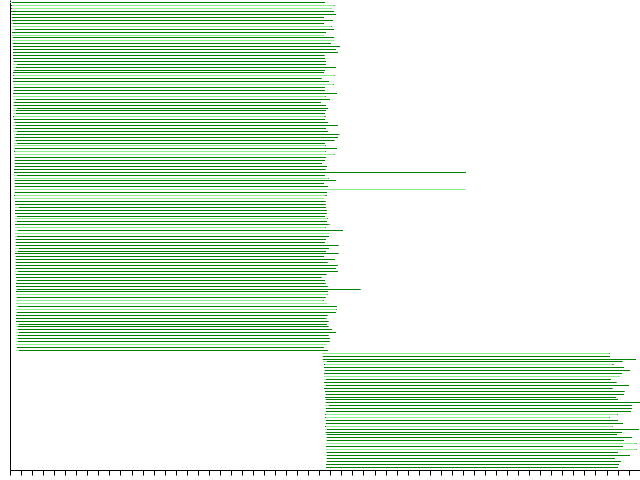
A couple of real-world examples:
(several thousand processes calling memcached; stages are: green is "connecting", yellow is "reading data", red is "retrying after a network error")
Running 160 approx.equal-length tasks on a 120-core cluster.


