Difference between revisions of "ThreadScope Tour"
Jump to navigation
Jump to search
(tidy up requirements section a bit) |
(bookmark chapter) |
||
| Line 28: | Line 28: | ||
<li>[[ThreadScope_Tour/Profile|Profile]]: examine the profile for a real program </li> |
<li>[[ThreadScope_Tour/Profile|Profile]]: examine the profile for a real program </li> |
||
<li>[[ThreadScope_Tour/Profile2|Profile 2]]: examine the profile for an improved program</li> |
<li>[[ThreadScope_Tour/Profile2|Profile 2]]: examine the profile for an improved program</li> |
||
| − | <li>[[ThreadScope_Tour/Zoom|Zoom]]: |
+ | <li>[[ThreadScope_Tour/Zoom|Zoom]]: zoom in to see performance behaviour at a finer resolution</li> |
| + | <li>[[ThreadScope_Tour/Bookmark|Bookmark]]: place a temporary marker in the eventlog</li> |
||
<li>[[ThreadScope_Tour/Consolidate|Consolidate]]: tease out the sequential parts of code</li></ol> |
<li>[[ThreadScope_Tour/Consolidate|Consolidate]]: tease out the sequential parts of code</li></ol> |
||
| Line 35: | Line 36: | ||
[[Image:spark-lifecycle.png|thumb]] |
[[Image:spark-lifecycle.png|thumb]] |
||
| − | <ol start=" |
+ | <ol start="9" style="list-style-type: decimal;"> |
<li>[[ThreadScope_Tour/SparkOverview|Spark overview]] |
<li>[[ThreadScope_Tour/SparkOverview|Spark overview]] |
||
<ul> |
<ul> |
||
Revision as of 19:50, 9 December 2011
A guided tour of ThreadScope
In this tutorial, we'll be working through concrete examples on using ThreadScope to debug the performance of parallel programs.
We aim to keep each module in the tutorial self-contained, so you can either follow the progression suggested or jump to just the sections we need.
Software
This tutorial is written with the following software versions in mind.
- ThreadScope 0.2.1
- GHC 7.4. (earlier versions work, but lack more advanced features like spark events)
Getting started

- Installation: install ThreadScope and run a sample trace
- Hello world: run ThreadScope on a small test program
Basic skills

- Initial statistics: collect some simple statistics
- Profile: examine the profile for a real program
- Profile 2: examine the profile for an improved program
- Zoom: zoom in to see performance behaviour at a finer resolution
- Bookmark: place a temporary marker in the eventlog
- Consolidate: tease out the sequential parts of code
Digging into a program with spark events

- Spark overview
- GHC RTS flags: a subset of flags relevant to ThreadScope
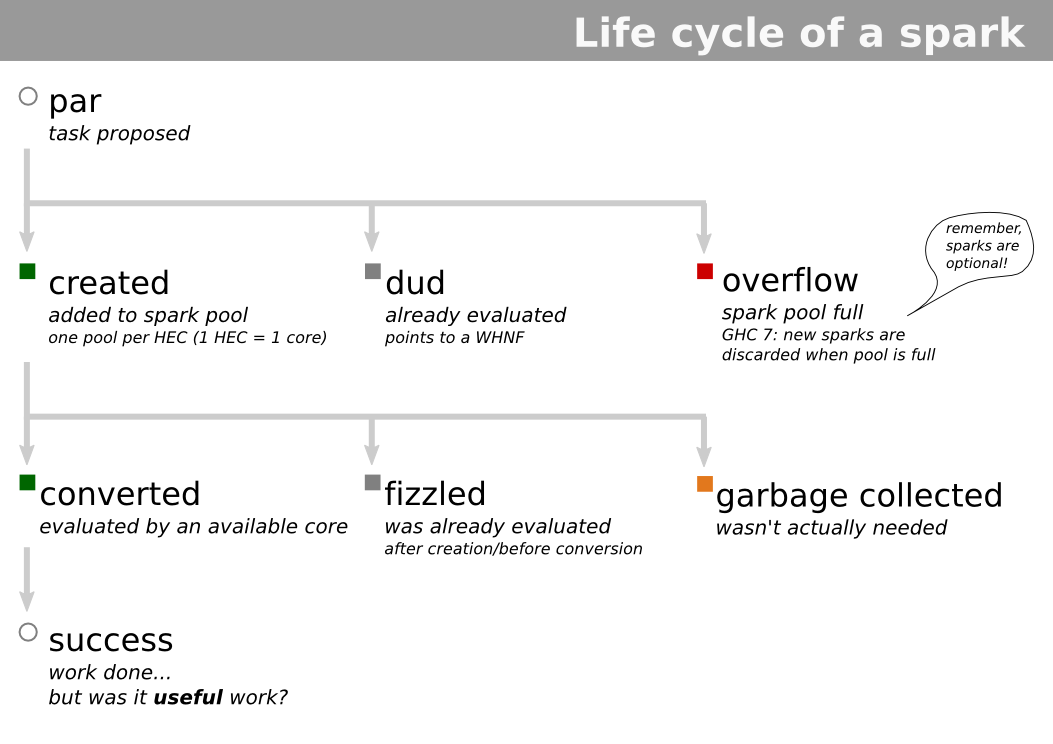
- Spark lifecycle: Lifecycle of a spark
- Spark rates: study spark creation/conversion
- Spark rates 2: spark debugging continued
Reference
- Downloads: examples used in this tutorial
This tutorial was initially written by Well-Typed in the context of the Parallel GHC Project. Feedback would be most appreciated!